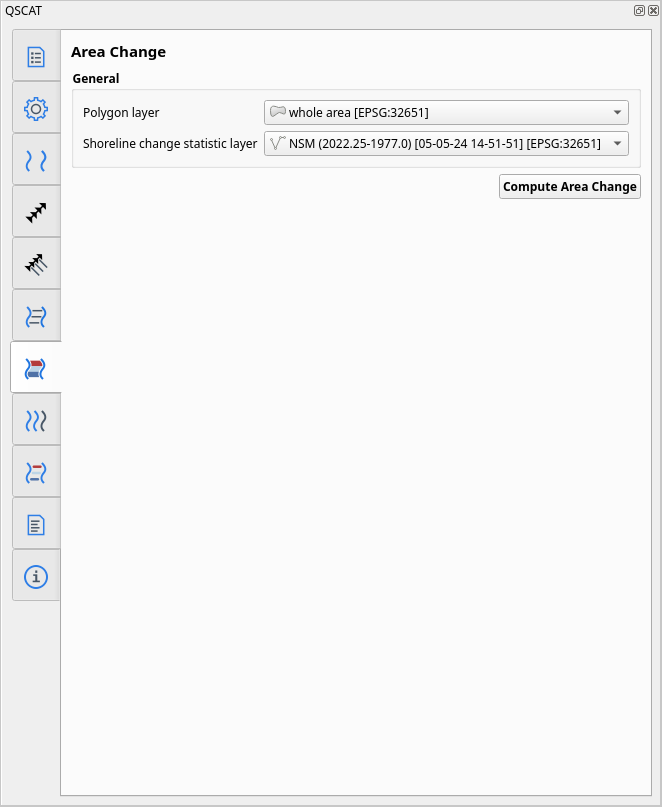
Tab: Area Change#
The Area Change Tab allows you to estimate the area change between two shoreline vectors for a given polygon layer. The polygon layer can be manually drawn or based on geographic boundaries (e.g., shapefiles of barangay, municipal boundaries), for which this type of analysis may be more meaningful. Monitoring how much coastal land a barangay or municipality has gained or lost is important for coastal planning and management. It is required that the boundary drawn encompasses all shorelines.
Note
This feature is currently in beta and has not undergone extensive testing on other coastal shorelines. While we encourage exploration, be aware that there may be occasional bugs or unexpected outputs. Feel free to provide feedback as you use it!

Fig. 33 User interface of Area Change Tab#
General#

Fig. 34 General section in Area Change Tab#
Polygon boundary#
A polygon type shapefile that encompasses the area of interest; may be drawn manually or based on geographic or administrative boundaries.
Stat layer#
A layer where the NSM and EPR statistics results are saved. Currently, area change can be calculated based on the NSM and EPR results.
How it works#

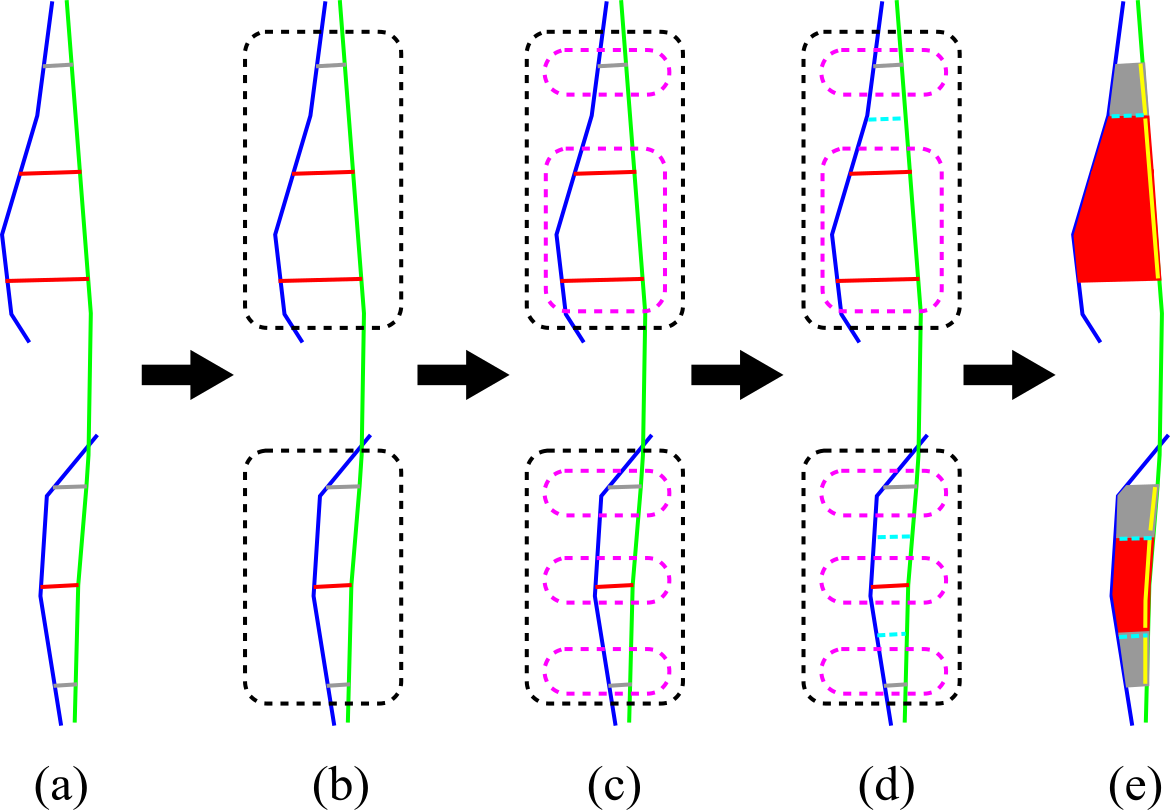
Fig. 35 Process of Area Change feature#
This feature allows you to analyze shoreline changes further by obtaining area measurements. It utilizes transects from the stat layer output of shoreline change and uses statistical values to group trends into erosion, stability, and accretion. This functionality also enables the extraction of new shoreline lengths. Currently, it supports NSM and EPR statistics for area change. The process for determining area change in QSCAT involves clustering the transects, grouping them by trends for each cluster, creating boundary transects between groups, and finally extracting the area between each boundary. The subsequent sections will delve deeper into each of these processes. As an example, we will use randomly drawn shorelines and transects to illustrate the process (Fig. 35).
Step (a): Preparing of the inputs#
You starts with two shorelines and an NSM or EPR statistic layer enclosed in a polygon. Note that the polygon boundary is not shown in the figure.
Step (b): Clustering the transects#
Clustering transects involves grouping the same transects intersecting the same shorelines. The three top-positioned transects (red line) should be grouped together, just as the three bottom-positioned transects (red line) should form another group. This grouping strategy addresses the issue of gaps that prevent the creation of a polygon, as indicated by the discontinuity in the blue line. For instance, both the blue and green lines represent shorelines. The black-dashed line polygon visually represents the clustering.
Step (c): Grouping by trends#
In QSCAT, each cluster of transects is organized based on their trend values (eroding, stable, and accreting). The gray line displays a stable transect, while the red line signifies an accreting transect. These are grouped based on their closeness and similar trends. The magenta dashed line polygon visually illustrates the grouping of trends within each cluster.
Step (d): Creating boundaries between groups#
Afterward, QSCAT inserts transects between groups for each grouped trend. Transects are inserted only between existing transects, as indicated by the orange dashed line. Furthermore, QSCAT precisely calculates and positions these inserted transects halfway between two existing transects.
Step (e): Extracting the area between boundaries#
Finally, for each cluster (black lines) and for each group of trends (magenta lines), the boundaries (cyan lines) and the two shorelines are used to extract the polygon, which is then used to get the area value. The three distinct gray polygons depict individual extracted stable area change polygons, while the red polygons illustrate individual extracted accreting area change polygons. Each polygon provides an area measurement in meters. QSCAT can also generate the length of new shorelines. If we assume the green shoreline is the most recent, the length of new shorelines are represented by the yellow line, from which we can obtain the vector length in meters.
Vector layer output#
Layer#
Layer |
Geometry |
Name |
|---|---|---|
Area |
|
|
Attributes#
Area#
Field name |
Data type |
Description |
|---|---|---|
|
|
Area value in square meters. |
|
|
Percentage of the current area in total area change. |
|
|
Trends (stable, eroding, or accreting) based on stat’s transects used. |
|
|
Vector length of the newest shoreline in meters. |
|
|
Percentage of the current newest shoreline length in total newest shoreline length. |
|
|
Vector length of the oldest shoreline in meters. |
|
|
Percentage of the current oldest shoreline length in total oldest shoreline length. |
|
|
Average of newest and oldest shoreline length in meters. |
|
|
Area value divided by the average shoreline length in meters. |
|
|
Attribute value of field |