Tab: Forecasting#
The Forecasting Tab allows you to forecast the shoreline position based on the Kalman Filter algorithm.
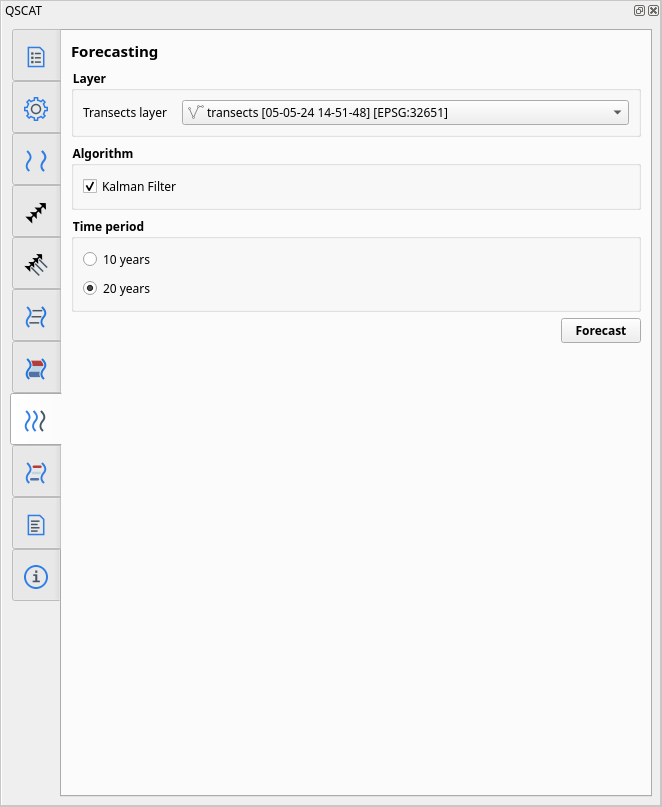
Fig. 36 User interface of Forecasting Tab#
Layer#
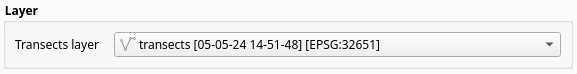
Fig. 37 Layer section in Forecasting Tab#
Allows you to select the transects layer to be used for forecasting. In QSCAT, the requirement for forecasting is a transect layer unlike DSAS. This allows you to run the forecasting algorithm without the need to run the shoreline change statistics.
Algorithm#

Fig. 38 Algorithm section in Forecasting Tab#
Kalman Filter#
Based on [Long and Plant, 2012], according to DSAS [Himmelstoss et al., 2018].
Time period#
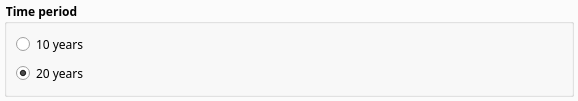
Fig. 39 Time period section in Forecasting Tab#
Allows you to select the forecast period (10 or 20 years) from now. “From now” refers to system date when the forecasting algorithm is executed.
Vector layer output#
The Kalman Filter forecasting algorithm output three vector layers:
Forecasted points is the forecasted points for each transect.
Forecasted line is a line string geometry connected by forecasted points.
Forecasted polygon is a polygon geometry connected by positive and negative forecasted uncertainty points.
Layers#
Layer |
Geometry |
Name |
|---|---|---|
Forecasted points |
|
|
Forecasted line |
|
|
Forecasted polygon |
|
|
Attributes#
Forecast points#
Field name |
Data type |
Description |
|---|---|---|
|
|
Selected forecast year period (10 or 20). |
|
|
Forecasted year calculated based from period. |
|
|
Magnitude value of forecasted distance. |
|
|
Value of forecasted uncertainty. |
|
|
X coordinate of the forecasted point. |
|
|
Y coordinate of the forecasted point. |
Forecast line#
Field name |
Data type |
Description |
|---|---|---|
|
|
Selected forecast year period (10 or 20). |
|
|
Forecasted year calculated based from period. |
|
|
Line length of connected forecasted points. |
Forecast polygon#
Field name |
Data type |
Description |
|---|---|---|
|
|
Selected forecast year period (10 or 20). |
|
|
Forecasted year calculated based from period. |
|
|
Polygon area of connected forecasted uncertainty. |