Tab: Summary Reports#
The Summary Reports Tab allows you to configure the save location, and enable or disable the generation of summary reports. The summary reports are text files that contain the base information and the summary of results of the shoreline change, area change, and forecasting results.
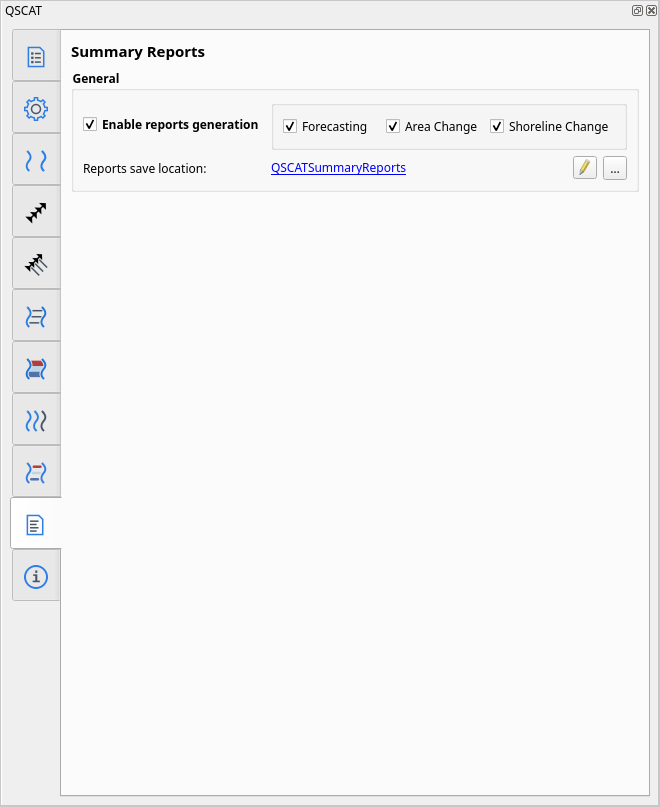
Fig. 43 User interface of Summary Reports Tab#
General#
Reports save location#
Allows you to choose the folder in which to save the summary reports. Defaults to QSCATSummaryReports under your user home directory. Additionally, each results type (shoreline change, area change, and forecasting) will be saved inside another folder within the specified folder. The filename of the report will be in the format qscat_<version>_<result_type>_<datetime>.txt, where the datetime is in the format MM-DD-YY HH-MM-SS. The following table shows the folder structure and the filename format of the summary reports.
Result |
Folder |
File name |
|---|---|---|
Shoreline Change |
|
|
Area Change |
|
|
Forecasting |
|
|
Example of the folder structure and file name#
── QSCATSummaryReports/
   ├── shoreline_change/
   │   ├── qscat_0.3.1_shoreline_change_04-29-24 15-15-28.txt
   │   ├── qscat_0.3.1_shoreline_change_05-01-24 10-30-12.txt
   │   └── ...
   │
   ├── area_change/
   │   ├── qscat_0.3.1_area_change_04-30-24 20-45-33.txt
   │   ├── qscat_0.3.1_area_change_05-02-24 14-25-46.txt
   │   └── ...
   │
   └── forecasting/
       ├── qscat_0.3.1_forecasting_04-28-24 18-55-21.txt
       ├── qscat_0.3.1_forecasting_05-03-24 09-10-58.txt
       └── ...
Enable reports generation#
A convenient way to enable or disable the generation of summary reports. You can also enable or disable the generation of individual reports of Shoreline Change, Area Change, and Forecasting results.
Content of summary reports#
Base information#
Regardless of the type of result (shoreline change, area change, or forecasting), the base information is always written at the top of the text file. The base information contains standard details such as general info, projection, metadata, and system details. The following are information that are included in the base information:
Project details#
Time generated: Date and time the report was generated (
MM-DD-YYYY HH-MM-SS)Project location: Folder location of the QGIS project (
.qgz)Projection: CRS auth id of the QGIS project (e.g
EPSG:32651)
Metadata#
Author full name: Metadata of the QGIS project
Author affiliation: Metadata of the QGIS project
Author email: Metadata of the QGIS project
System details#
OS version: Operating system name and version (e.g.
Linux 6.5.0-18-generic)QGIS version: QGIS version and name (e.g.
3.34.5-Prizrena)QSCAT version: QSCAT plugin version (e.g.
0.3.1)
Shoreline Change#
Input parameters#
Shorelines Tab
Layer: Layer name of the selected shorelines
Default data uncertainty: Default data uncertainty value
Date field: Field name of the selected shorelines date
Uncertainty field: Field name of the selected shorelines uncertainty value
Dates: List of date values of the selected shorelines (format
MM/YYYY)Uncertainties: List of uncertainty values of the selected shorelines
Baseline Tab
Layer: Layer name of the selected baseline
Placement: Placement of the selected baseline
Orientation: Orientation of the selected baseline
Transects Tab
Layer output name: Layer output name of the transects
Transect count: By transect spacing or number of transects
Transect spacing: Transect spacing value (if by transect spacing is selected)
By number of transects: Number of transects value (if by number of transects is selected)
Transect length: Transect length value
Smoothing distance: Smoothing distance value
Shoreline Change Tab
Transects layer: Layer name of the selected transects
Clip transects: Yes or No
Intersections: Choose by distance or choose by placement
By distance: Farthest or closest (if choose by distance is selected)
By placement: Seaward or landward (if choose by placement is selected)
Selected statistics: List of selected shoreline change statistics
Newest date: Selected newest date of the selected shorelines
Oldest date: Selected oldest date of the selected shorelines
Newest year: Selected newest date converted into decimal year in pairwise comparison of shorelines
Oldest year: Selected oldest date converted into decimal year in pairwise comparison of shorelines
Confidence interval: Confidence interval value in percentage
Summary of results#
SHORELINE CHANGE ENVELOPE (SCE)
Avg. value: Average value of the SCE
Max. value: Maximum value of the SCE
Min. value: Minimum value of the SCE
NET SHORELINE MOVEMENT (NSM)
Avg. distance: Average value of the NSM
Eroding, Accreting, and Stable:
No. of transects: Number of transects
(%) transects: Percentage of transects
Avg. value: Average value
Max. value: Maximum value
Min. value: Minimum value
END POINT RATE (EPR)
Avg. rate: Average value of the EPR
Eroding, Accreting, and Stable:
No. of transects: Number of transects
(%) transects: Percentage of transects
Avg. value: Average value
Max. value: Maximum value
Min. value: Minimum value
LINEAR REGRESSION RATE (LRR)
Eroding and Accreting:
No. of transects: Number of transects
(%) transects: Percentage of transects
Avg. value: Average value
Max. value: Maximum value
Min. value: Minimum value
WEIGHTED REGRESSION RATE (WLR)
Eroding and Accreting:
No. of transects: Number of transects
(%) transects: Percentage of transects
Avg. value: Average value
Max. value: Maximum value
Min. value: Minimum value
Area Change#
Input parameters#
Polygon layer: Layer name of the selected polygon layer
Shoreline change statistic layer: Layer name of the selected shoreline change statistic layer
Summary of results#
AREA CHANGE
Total area: Total square meters area value
Eroding, Accreting, and Stable
(%) of areas: Percentage of area value in total area
No. of areas: Number of areas with
(%) of no. areas: Percentage of number of areas
Avg. value: Average area value
Max. value: Maximum area value
Min. value: Minimum area value
NEWEST AND OLDEST SHORELINE (LENGTH)
Total length: Total length value in meters
Eroding, Accreting, and Stable
Total of lengths: Total length value in meters
(%) of lengths: Percentage of length value in total length
No. of lengths: Number of lengths
(%) of no. lengths: Percentage of number of lengths
Avg. value: Average length value
Max. value: Maximum length value
Min. value: Minimum length value
MEAN SHORELINE DISPLACEMENT
Avg. value: Average value
Max. value: Maximum value
Min. value: Minimum value
Forecasting#
The Forecasting summary report is not yet available.