Tab: Shoreline Change#
The Shoreline Change Tab allows you to calculate the following shoreline change statistics: (a) Shoreline Change Envelope (SCE), (b) Net Shoreline Movement (NSM), (c) End-Point Rate (EPR), and (d) Linear Regression Rate (LRR). The first three statistics (SCE, NSM, and EPR) require only two shoreline vectors, while LRR requires at least three (3) shoreline vectors to compute the rate of change. SCE and NSM refer to magnitude or distance in meters (m), while EPR and LRR are rate-of-change statistics in meters/year (m/y).
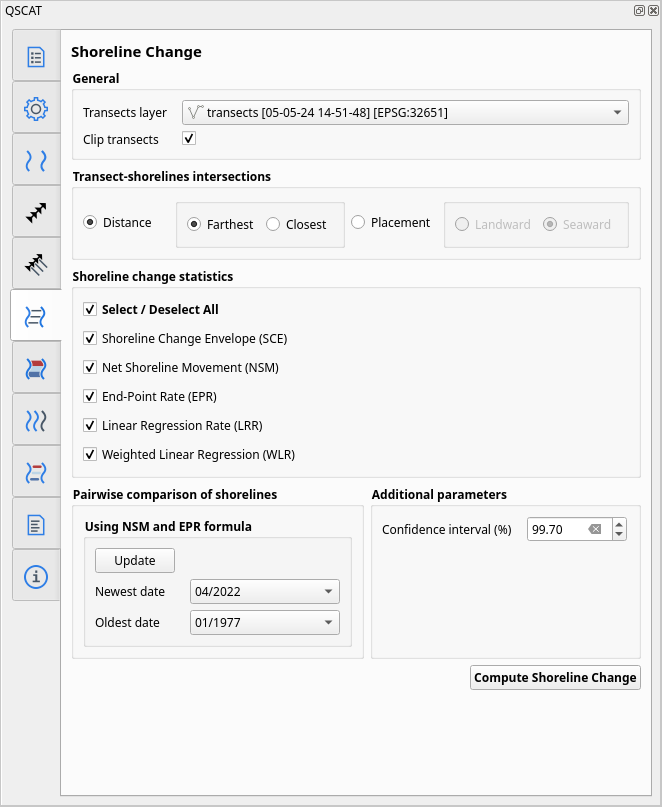
Fig. 26 User interface of Shoreline Change Tab#
General#
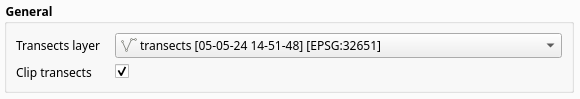
Fig. 27 General section in Shoreline Change Tab#
Transects layer#
This run requires a transect layer to calculate the selected statistics in the Shoreline Change Statistics section. The output statistics will be tabulated in the Attribute Table, which can then be exported as a worksheet file and/or viewed in map format.
Clip transects#
By default, the transects are not clipped to the farthest shoreline extent. However, you have the power to choose whether to clip the shorelines by checking this box. The clipping has no effects on the statistics, but it will make seeing statistics’ transects easier.
Transect-shoreline intersections#
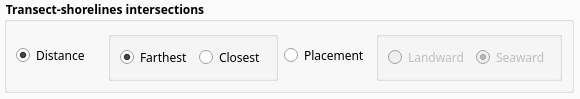
Fig. 28 Transect-shoreline intersections section in Shoreline Change Tab#
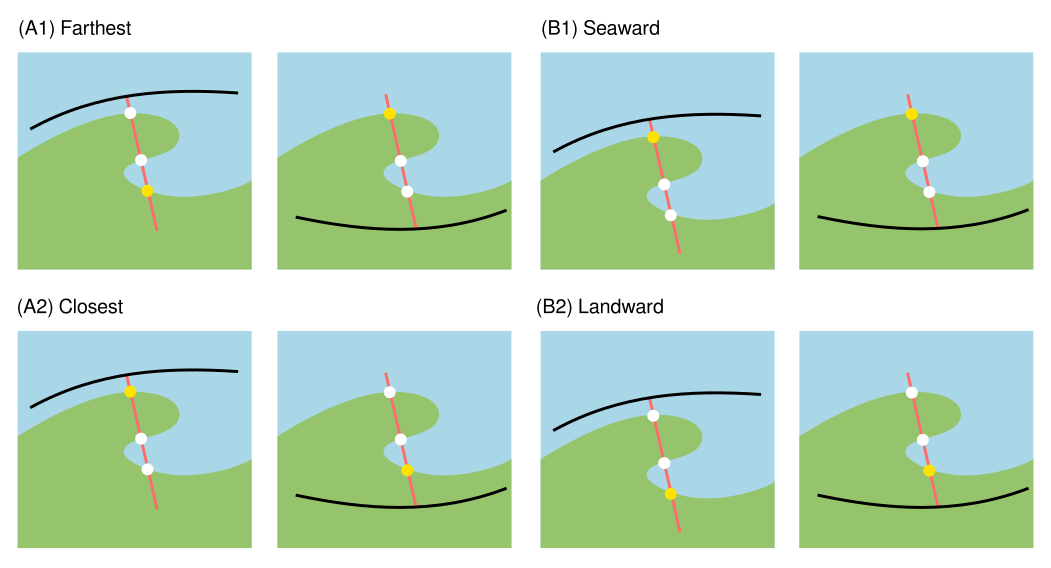
Fig. 29 Guide on determining the intersection point of transects and shorelines#
Sometimes, a transect intersects the shoreline vector at more than one point, particularly on curved segments (Fig. 29). To handle shoreline vector/s with multiple intersections, QSCAT allows you to choose the intersection point by distance (i.e., farthest or closest to the baseline) or by placement (seaward or landward, similar to DSAS). As it will affect the distance between the intersection points at the baseline and the shoreline, it is recommended that the selected option be applied to all shorelines for analysis.
Shoreline change statistics#
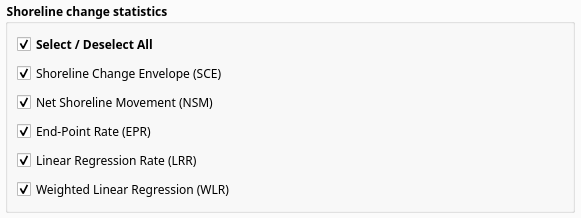
Fig. 30 Shoreline change statistics section in Shoreline Change Tab#
The shoreline change statistics in QSCAT and the resulting sample attribute table (Table 1) are described below.
Statistics |
Description |
|---|---|
|
Shoreline Change Envelope |
|
Net Shoreline Movement |
|
End-Point Rate |
|
Uncertainty of End-Point Rate |
|
Linear Regression Rate |
|
R-Squared of Linear Regression |
|
Standard Error of Linear Regression |
|
Confidence Interval of Linear Regression |
|
Weighted Linear Regression Rate |
|
R-Squared of Weighted Linear Regression |
|
Standard Error of Weighted Linear Regression |
|
Confidence Interval of Weighted Linear Regression |
Shoreline Change Envelope (SCE)#
The shoreline change envelope (SCE) is the maximum distance, in meters (m), among all the shorelines intersecting a given transect [Himmelstoss et al., 2018]. If there are multiple shoreline vectors, one can quickly identify the most significant magnitude of shoreline movement (SCE_value column) and when it occurred (SCE_closest year and SCE_farthest year columns) in the resulting attribute table of shoreline change statistics (Table 1). Since SCE is a distance, all values are positive. The shoreline trends can be inferred from the SCE_trend column, depending on whether SCE represents erosion, accretion, or stability.
Net Shoreline Movement (NSM)#
The net shoreline movement (NSM) represents the magnitude of shoreline change between the oldest and youngest shorelines in meters (m) and is calculated as:
The uncertainty is based on the shoreline with the largest uncertainty values in the attribute table of the input layer.
End-Point Rate (EPR)#
The end-point rate (EPR) is the rate of change based on NSM, in meters/year (m/y), and is calculated as:
Both NSM and EPR require only two shoreline vectors, the youngest and oldest. QSCAT will ignore any shoreline vector/s between the youngest and oldest years. As such, it provides no information about shoreline movement during the intervening years, even if there are multiple shoreline positions in the input layer. Additional information may be inferred from the SCE, which can at least identify the greatest magnitude of change and the corresponding period for a given set of shoreline vectors.
Linear Regression Rate (LRR)#
For multiple shoreline positions, a more appropriate rate-of-change statistic to use is the linear regression rate-of-change (LRR) since it takes into consideration all shoreline positions in the calculation, not just the endpoints like NSM and EPR do. In fact, LRR requires at least three (3) shoreline vectors or intersection points to calculate the rate of change, in m/y, for a given transect. LRR is determined from the slope of a least-squares regression line fitted to all shoreline intersection points for each transect.
where:
\(n\) - length of years and distances
\(\bar{x}\) - mean of years
\(\bar{y}\) - mean of distances
\(x_i\) - ith year
\(y_i\) - ith distance
Weighted Linear Regression (WLR)#
In WLR, uncertainty values are converted to weights:
where:
\(e\) - uncertainty value of a shoreline
Then, a weighted linear regression is performed using the weights. The resulting slope is the WLR:
where:
\(n\) - length of years and distances
\(\bar{x}_w\) - weighted mean of years
\(\bar{y}_w\) - weighted mean of distances
\(x_i\) - ith year
\(y_i\) - ith distance
\(weight_i\) - ith weight
Supplementary Statistics#
Uncertainty of End-Point Rate (EPR_unc)#
The uncertainty of EPR (EPR_unc) is based on the following formula, after DSAS [Himmelstoss et al., 2018]:
where:
\(uncyA\) - uncertainty of the youngest shoreline A
\(uncyB\) - uncertainty of the oldest shoreline B
\(yearA\) - year of youngest shoreline A
\(yearB\) - year of oldest shoreline B
R-Squared of Linear Regression (LR2 or WR2)#
where:
\(n\) - length of years and distances
\(\hat{y}\) - predicted ith distance (\(LRR\ or\ WLR*x_i + intercept\))
\(\bar{y}\) - mean of distances
\(y_i\) - actual ith distance
Standard Error of Estimate of Linear Regression (LSE or WSE)#
where:
\(n\) - length of years and distances
\(\hat{y}\) - predicted ith distance (\(LRR\ or\ WLR*x_i + intercept\))
\(y_i\) - actual ith distance
Confidence Interval of Linear Regression (LCI or WCI)#
where:
\(\alpha\) - \(1 - (confidence\_interval*.01)\) (confidence interval in percent)
\(t\_inv()\) - student’s t-distribution function
\(LSE\) - standard error of estimate of linear regression
\(WSE\) - standard error of estimate of weighted linear regression
\(n\) - length of years and distances
\(\bar{x}\) - mean of years
\(x_i\) - ith year
Pairwise comparison of shorelines#
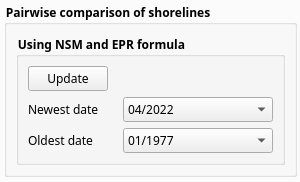
Fig. 31 Pairwise comparison of shorelines in Shoreline Change Tab#
By default, NSM and EPR calculate the magnitude and rate of shoreline changes between the oldest and most recent shorelines, even if multiple shorelines are available. In QSCAT, the algorithm for calculating NSM and EPR can be applied to any two shorelines from the selected shoreline layer by specifying the dates of the two shorelines for comparison. While LRR can estimate the net rate of change among multiple shorelines, the pairwise comparison can better understand how the shoreline has evolved over different periods, as well as the possible causes of the observed trends.
Additional parameters#
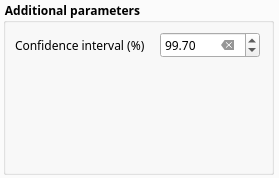
Fig. 32 Additional parameters section in Shoreline Change Tab#
Currently, additional parameters include a field that defines the confidence interval value for calculating LCI and WCI. The default value is 99.7%, based on DSAS [Himmelstoss et al., 2018].
Vector layer output#
Layers#
Layer |
Geometry |
Name |
|---|---|---|
|
|
|
|
|
|
|
|
|
|
|
|
|
|
|
Attributes#
Shoreline Change Envelope (SCE)#
Field name |
Data type |
Description |
|---|---|---|
|
|
Shoreline Change Envelope (SCE) value in meters. |
|
|
The highest uncertainty value used in the calculation of SCE. |
|
|
Trends (stable, erosion, or accretion) based on SCE and uncertainty value. |
|
|
Shoreline year closest to the baseline. |
|
|
Shoreline year farthest from the baseline. |
Net Shoreline Movement (NSM)#
Field name |
Data type |
Description |
|---|---|---|
|
|
Net Shoreline Movement (NSM) value in meters. |
|
|
The highest uncertainty value used in the calculation of NSM. |
|
|
Trends (stable, erosion, or accretion) based on NSM and uncertainty value. |
End-Point Rate (EPR)#
Field name |
Data type |
Description |
|---|---|---|
|
|
End-Point Rate (EPR) value in meters/year. |
|
|
Uncertainty of End-Point Rate (EPR) value in meters/year. |
|
|
Trends (stable, erosion, or accretion) based on EPR and uncertainty value. |
Linear Regression Rate (LRR)#
Field name |
Data type |
Description |
|---|---|---|
|
|
Linear Regression Rate (LRR) value in meters/year. |
|
|
R-Squared of Linear Regression (LR2) value. |
|
|
Standard Error of Linear Regression (LSE) value. |
|
|
Confidence Interval of Linear Regression (LCI) value. |
Weighted Linear Regression (WLR)#
Field name |
Data type |
Description |
|---|---|---|
|
|
Weighted Linear Regression Rate (WLR) value in meters/year. |
|
|
R-Squared of Weighted Linear Regression (WR2) value. |
|
|
Standard Error of Weighted Linear Regression (WSE) value. |
|
|
Confidence Interval of Weighted Linear Regression (WCI) value. |